Computer Lab Reporting and Usage Analytics
When are your labs busiest? Which rooms sit half empty, which types of workstations always have a waitlist, and can you shorten open hours without hurting students? Without reliable data, lab managers answer these questions by guesswork, and it becomes hard to justify staffing levels, budgets and equipment purchases.
VeraLab collects this data automatically as part of everyday operations: every sign-in, waitlist entry, staff shift and maintenance issue is recorded. Built-in reports turn it into tables and charts you can filter by time period and room, drill into, and export to Excel, so decisions about scheduling, staffing, budgeting and purchasing rest on actual usage.
Built-In Reports
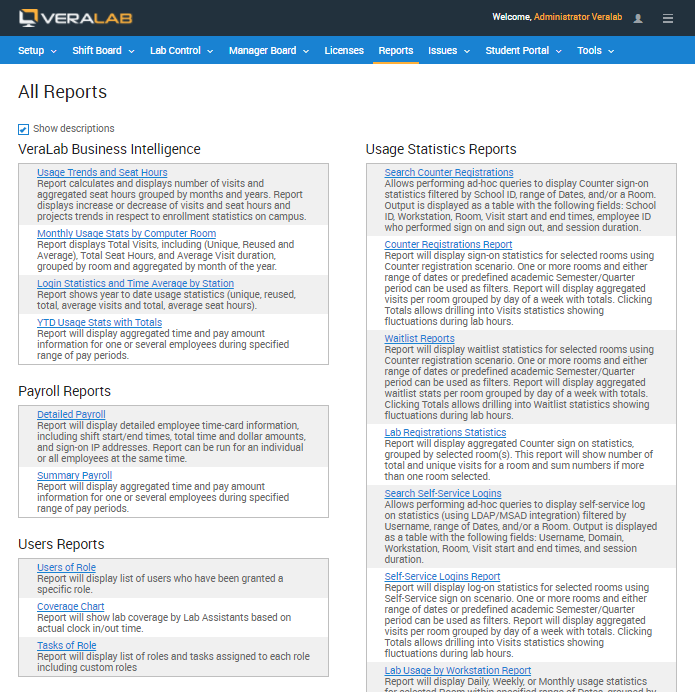
VeraLab ships with many reports that provide statistics about your lab environment and usage patterns, grouped on the All Reports page. They include:
| Group | Reports |
|---|---|
| VeraLab Business Intelligence | Usage Trends and Seat Hours (visits and seat hours by month and year, with trends relative to campus enrollment), Monthly Usage Stats by Computer Room, Login Statistics and Time Average by Station, YTD Usage Stats with Totals |
| Usage Statistics | Search Counter Registrations, Counter Registrations Report, Waitlist Reports, Lab Registrations Statistics, Search Self-Service Logins, Self-Service Logins Report, Lab Usage by Workstation Report |
| Payroll | Detailed Payroll, Summary Payroll |
| Users | Users of Role, Coverage Chart, Tasks of Role |
Technicians and License Administrators have their own report sets, and payroll and coverage reports are described on the staff clock-in and payroll page.
Report Filters and Time Periods
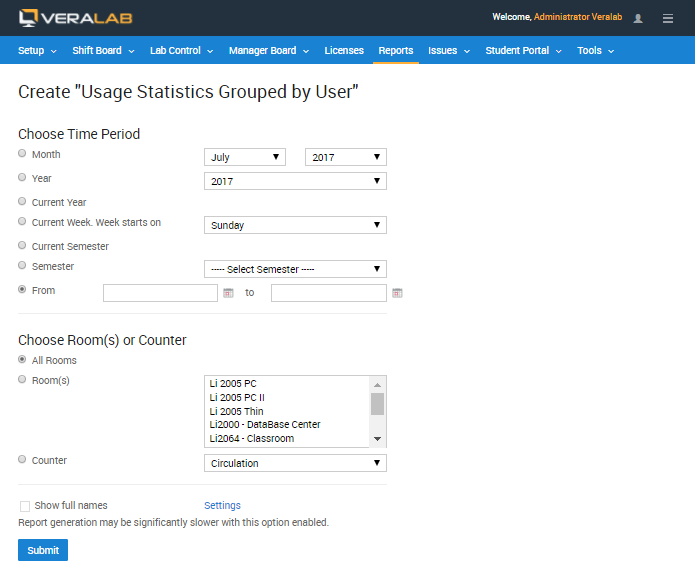
Each report lets you set detailed search and filtering criteria. Choose a month, a year, the current year, the current week (with the day your week starts on), the current semester, a predefined semester, or a custom date range, then pick all rooms, specific rooms, or a counter. To report on a period such as a quarter, an administrator first defines its dates in the Semesters task; the new period then appears in the report drop-down lists.
Usage Patterns by Day and Hour
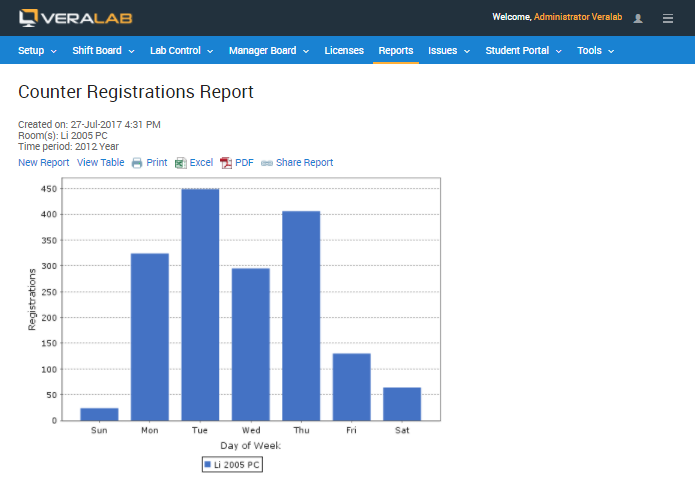
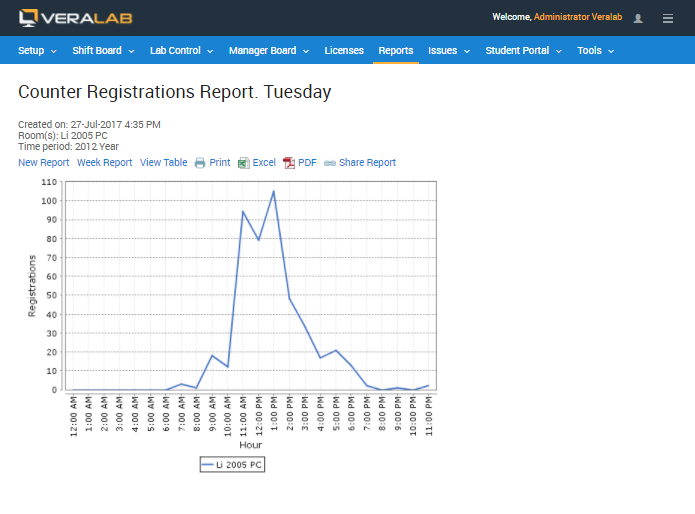
The system presents transactional data in tabular and graphical form. Lab usage reports show sign-on activity by day of the week, and you can drill down from the weekly view to hourly activity for a single day, revealing peak periods and quiet ones. Counter and self-service reports work the same way, and Waitlist reports show aggregated waitlist statistics per room by day of the week.
Live Dashboards
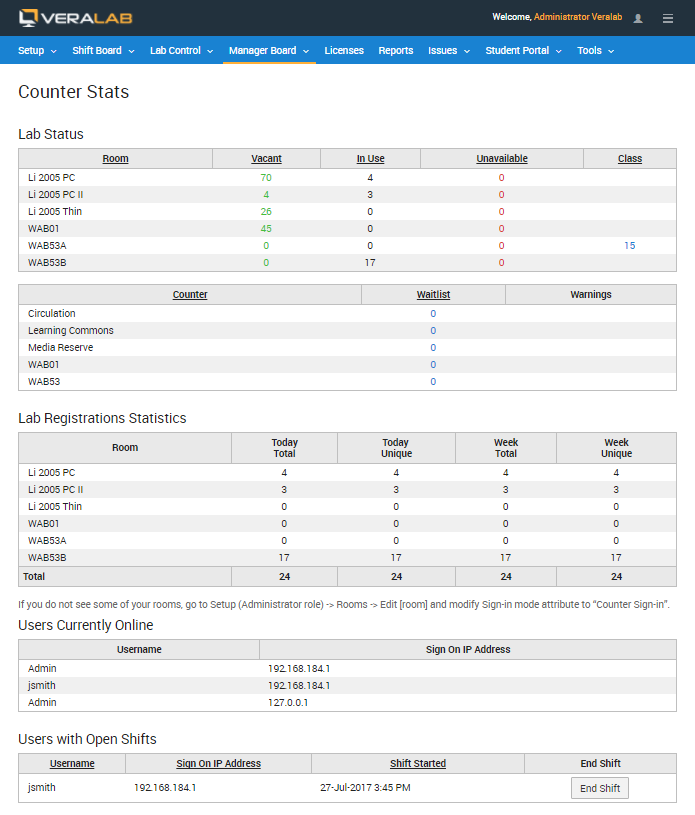
For the current picture, the Manager Dashboard shows the status of every room (vacant, in use, unavailable and reserved for a class), the waitlist at each counter, today's and this week's total and unique registrations by room, users currently online and staff with open shifts. Because VeraLab is web-based, managers can check it from anywhere. For students, the Student Portal shows real-time lab availability and open hours.
Export to Excel, CSV and PDF
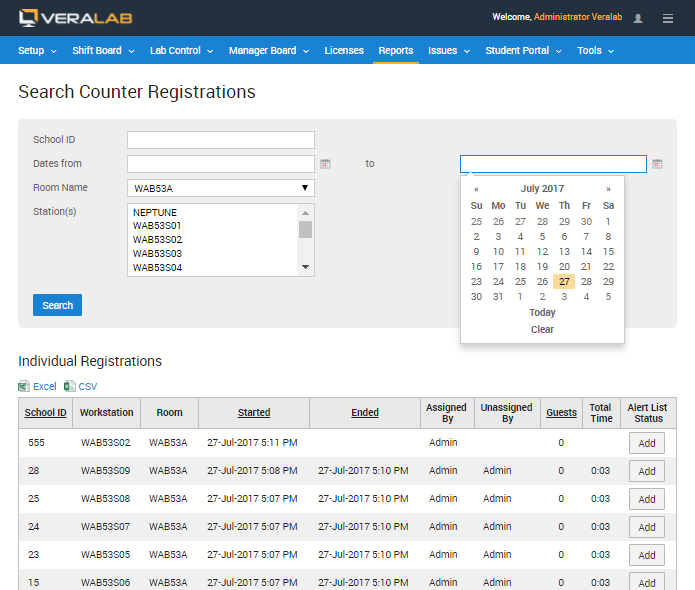
Report output can be printed, saved as PDF, shared, or exported to Microsoft Excel. Since VeraLab 26.1, reports generate in Excel (.xlsx) format, ready to filter, sort and share, and search results such as access log queries can also be exported to CSV. The Audit Log can be exported to CSV or Excel too, which makes it simple to archive activity records or pass them to your security and compliance tools.
Software Usage and License Costs
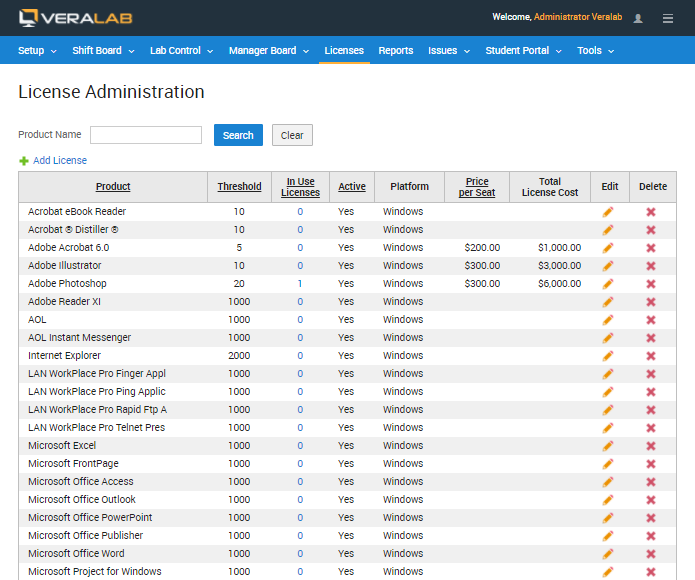
VeraLab also helps analyze application usage and cost of ownership. License Administration lists each tracked product with its license threshold, licenses currently in use, price per seat and total license cost, giving you the usage and cost data needed to analyze software cost of ownership.
Using the Data
- Scheduling and staffing. Historical occupancy by day, time and room shows when to add staff and, if open hours must be cut, which low-traffic periods to cut with the least impact on users.
- Purchasing and budgets. Usage statistics reveal shortages of certain types of equipment, while maintenance cost and downtime data help you avoid vendors with high maintenance costs. See issue tracking.
- Demand for equipment. Usage, waitlist and occupancy data by workstation type show where to invest and which systems are underused.
- Payroll. Attendance data is ready to present to HR for payroll processing.
Related features
Back to the VeraLab product overview, or browse the full VeraLab feature list with screenshots of every module.